
Tanzania’s corporate tax system, designed to support public revenue and attract business investments, remains challenged by inefficiencies and inequities that impede the nation’s economic development. The Tanzania Revenue Authority (TRA), operational since 1996, has undertaken numerous reforms to improve tax administration. Despite these efforts, substantial gaps in policy effectiveness and execution persist.
The uniform corporate tax rate in Tanzania is 30%, applied universally to all resident corporations. This rate is intended to strike a balance between attracting foreign investment and generating needed public revenue. However, given Tanzania’s economic makeup—where the informal sector accounts for about 47% of the GDP and where small and medium-sized enterprises (SMEs) play a pivotal role—this flat rate may not be the most conducive for economic growth. For SMEs, particularly, a 30% tax rate could be inhibitive, potentially stifling domestic economic activity and innovation.
Policies and Laws Governing Corporate Tax in Tanzania
Tanzania’s corporate tax system is governed by a robust framework of laws, policies, and regulations aimed at ensuring compliance, revenue collection, and fostering a conducive environment for investment. At its core is the Income Tax Act, 2004, which outlines the standard corporate tax rate of 30%, defines taxable income, and specifies deductions and exemptions available to businesses. Small enterprises benefit from a presumptive tax regime, while certain industries, such as mining and petroleum, operate under specialized provisions. Complementing this is the Value Added Tax (VAT) Act, 2014, which influences corporate tax indirectly by mandating VAT compliance, thereby affecting the overall tax liability of businesses.
To attract investment, the Investment Act, 1997 provides tax holidays, exemptions, and preferential rates for sectors deemed strategic to national development, while the Mining Act, 2010 (amended in 2017) introduces sector-specific taxation policies to enhance transparency and ensure equitable revenue sharing. The Finance Acts, updated annually, reflect the government’s fiscal priorities by introducing amendments to tax laws, adjusting rates, or modifying incentives. Additionally, the Public-Private Partnership (PPP) Act, 2010 supports infrastructure and energy projects through tax benefits for companies engaged in such collaborations. Tax administration is centralized under the Tax Administration Act, 2015, which empowers the Tanzania Revenue Authority (TRA) to enforce compliance, manage registration, and resolve disputes.
Regionally, Tanzania’s tax policies are influenced by its membership in the East African Community (EAC) and Southern African Development Community (SADC), which aim to harmonize tax laws and minimize double taxation among member states. Together, these legal and policy instruments provide a comprehensive framework for corporate taxation in Tanzania, ensuring alignment with domestic priorities and regional goals. However, their effectiveness in achieving investment objectives relies heavily on consistent implementation, administrative efficiency, and the ability to adapt to evolving economic conditions.
Data Analysis
The analysis of corporate tax collections in Tanzania Mainland from 1996 to 2022 reveals significant insights. A linear regression analysis of inflation-adjusted corporate tax revenues indicates a clear upward trend over the years, as reflected by the red trend line in the chart. The positive slope suggests that corporate tax collections have generally increased in real terms during this period. The R-squared value, approximately 0.828, demonstrates that 82.8% of the variation in inflation-adjusted corporate tax collections can be attributed to the progression of time, signifying a strong relationship between the year and real tax revenue.
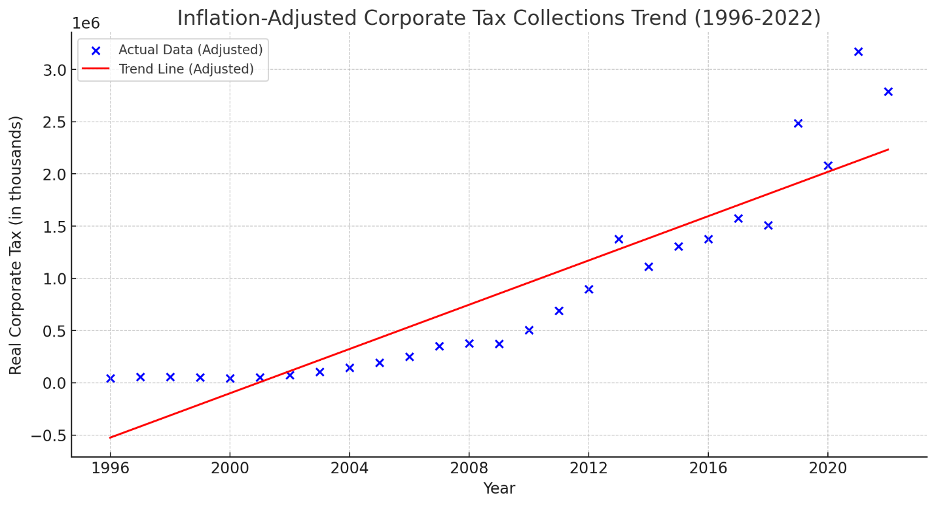
In terms of volatility, the standard deviation of corporate tax collections is roughly 942,696, indicating notable fluctuations in the amount collected annually. The coefficient of variation, at 1.045, reveals that the standard deviation is about 104.5% of the mean, highlighting substantial variability relative to the average collections. This suggests that while the overall trend points upwards, year-to-year tax revenues are subject to significant changes, potentially influenced by economic conditions, corporate profitability, or shifts in tax policy.
Overall, these findings underscore a consistent growth in corporate tax revenues over time, accompanied by a high degree of annual variability thus for financial planning and budgeting, this means the government cannot fully rely on steady growth in corporate tax revenues. While the long-term trend is upward, the short-term unpredictability makes it challenging to plan expenditures. Policymakers might need to explore ways to stabilize tax revenues, such as diversifying the tax base or introducing measures to reduce volatility in collections.
Corporate Tax -to-GNI Ratio
The analysis of Tanzania Mainland’s tax data from 1996 to 2022 reveals a compelling narrative about the relationship between corporate tax contributions and total tax collections. The Corporate Tax-to-GNI Ratio, represented by the green line, shows a consistent decline over the years, starting at approximately 1.52% in 1996 and falling significantly by 2022. The orange dashed line marks the average ratio of 1.19%, serving as a benchmark for comparison. This trend suggests that corporate tax revenues, as a share of the national income, have been diminishing over time.
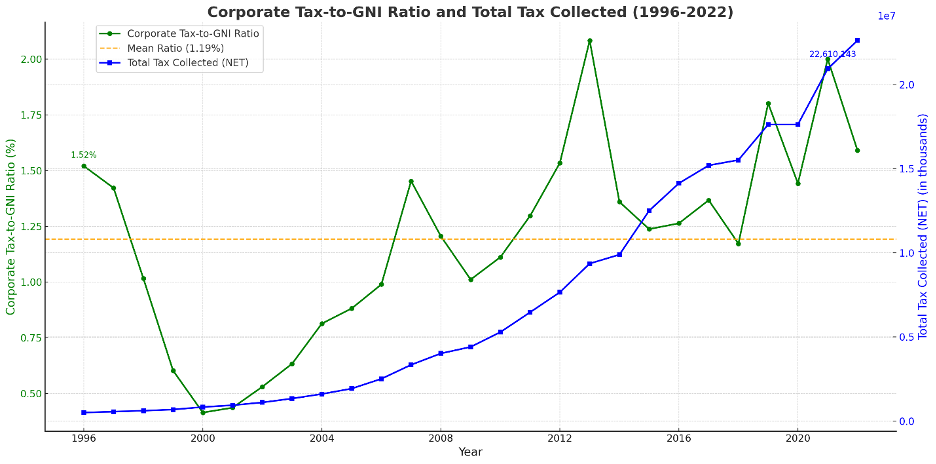
In contrast, the Total Tax Collected (NET), represented by the blue line, demonstrates a steady upward trend, reflecting improved tax collection efforts or economic growth. The marked divergence between the rising total tax revenues and the declining Corporate Tax-to-GNI Ratio highlights a potential shift in the tax structure, with other taxes, such as VAT or income taxes, contributing more significantly to overall tax revenues. Annotations on key years further emphasize the magnitude of these changes, making it clear that while the government’s ability to collect taxes has strengthened, corporate taxes have become a smaller proportion of the national income.
This divergence raises important policy considerations. While overall tax revenues are growing, the declining relative contribution of corporate taxes could suggest inefficiencies, changing economic structures, or increased reliance on non-corporate tax sources. Policymakers may need to investigate the underlying causes, such as tax incentives, compliance gaps, or shifts in the economy, to ensure a balanced and sustainable revenue base. This analysis underscores the need to align corporate tax contributions more closely with economic growth to support equitable fiscal policies.
Global Policy Review
Globally, corporate tax rates vary, reflecting diverse economic priorities as seen from the corporate tax rate distributions across 148 countries, representing 76% of the world’s 195 recognized nations. The 20–30% range is the most common, including 70 countries (47% of the dataset), such as the United States, Germany, China, and developing nations like Kenya, Tanzania and India. This range reflects a balance between attracting foreign direct investment (FDI) and generating sufficient public revenue.
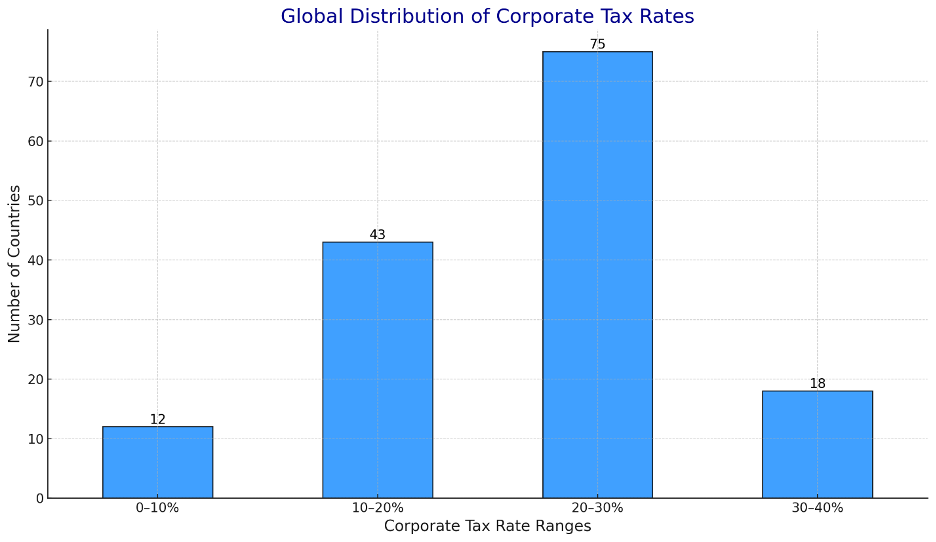
The 0–10% range, with only 13 countries (9%), includes tax havens like the Bahamas, Cayman Islands, and Hungary, which leverage ultra-low rates to position as global financial hubs. These nations often rely on alternative revenue streams, such as tourism and financial services, to compensate for reduced corporate tax revenue.
Conversely, the 30–40% range comprises 19 countries (13%), including Argentina, Brazil, and Malta, which prioritize revenue generation through higher tax rates. However, these rates can reduce competitiveness in attracting global investment.
The 10–20% range, with 32 countries (22%), features economies like Ireland, Singapore, and Romania, which use low corporate tax rates alongside sector-specific incentives to attract FDI in industries such as technology and finance.
The analysis reveals a global trend toward moderate tax rates, with the majority of countries clustered in the 10–30% range, highlighting the importance of balanced tax policies to sustain fiscal stability and economic growth. Countries with zero corporate tax rates, such as Bahrain and Bermuda, are rare and often depend on sectors like tourism or natural resources. These findings emphasize the diversity in corporate tax strategies, as nations tailor policies to their economic priorities, balancing competitiveness and revenue needs.
Balancing Revenue with FDI
Analysis reveals interesting insights into the relationship between corporate tax brackets and average GDP growth rates. In the 0-10% tax bracket, countries exhibit the highest average GDP growth rate of 9.7%, highlighting the potential economic boost from minimal tax burdens. This could reflect favorable business environments, increased investment, or unique circumstances like small economies or tax havens driving high growth.
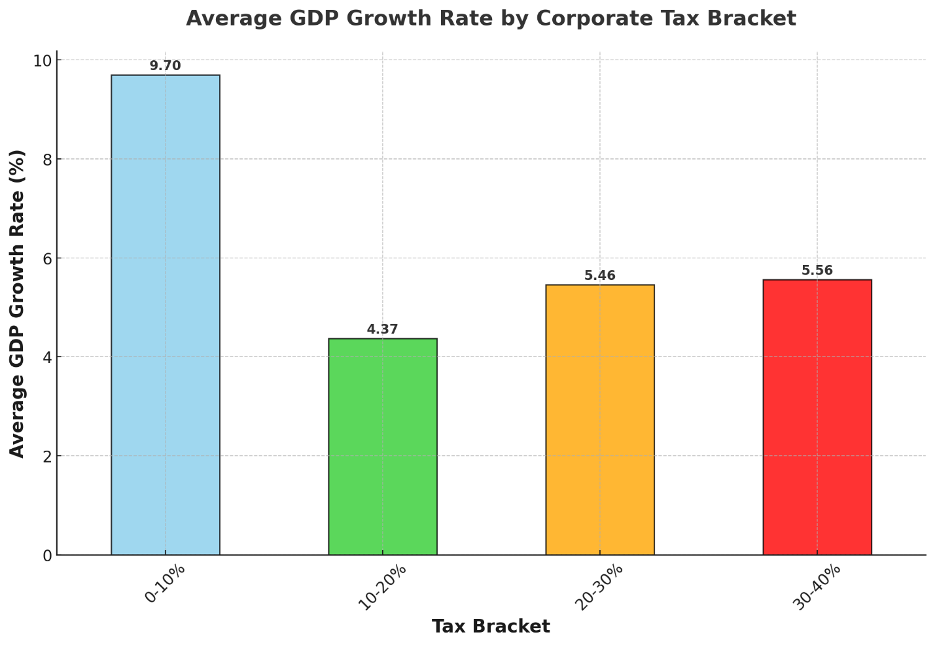
In the 10-20% bracket, the average GDP growth rate declines significantly to 4.37%, suggesting that while moderate tax rates still support growth, they might begin to impose noticeable economic constraints compared to lower brackets.
Interestingly, the 20-30% bracket sees a slight recovery, with an average GDP growth rate of 5.46%. This indicates that while higher tax rates may create additional burdens, other factors, such as economic stability or effective government use of tax revenue, could offset potential growth deterrents.
In the 30-40% tax bracket, the average GDP growth rate is 5.56%, marginally higher than the 20-30% bracket. This outcome suggests that at very high tax rates, economies may stabilize or even slightly improve if those taxes are part of a well-structured fiscal policy or are accompanied by other growth-supportive factors.
Epilogue
In summary, while Tanzania’s 30% corporate tax rate aims to balance investment and revenue generation but may not fully address the economy’s complexities, as the non-linear relationship between tax rates and GDP growth highlights the need for strategic policies to foster growth while ensuring fiscal sustainability.
This is evident in the observation that while very low tax rates often drive the highest economic growth, moderate to high tax rates yield mixed outcomes, likely shaped by broader economic and structural factors. These findings highlight the importance of strategic tax policy design to effectively balance the dual objectives of fostering economic growth and generating sustainable revenue.
Tanzania must reassess its corporate tax policies with a focus on flexibility, fairness, and effective enforcement to foster a resilient economy that supports sustainable growth, while adopting a differentiated framework to enhance equity and inclusivity across sectors and business sizes.
Read more Articles on Tanzania Taxes